Data analysis is the process of inspecting, cleaning, transforming, and modeling data with the goal of extracting useful information, drawing conclusions, and supporting decision-making. It is a crucial step in the broader field of data science and involves several steps:
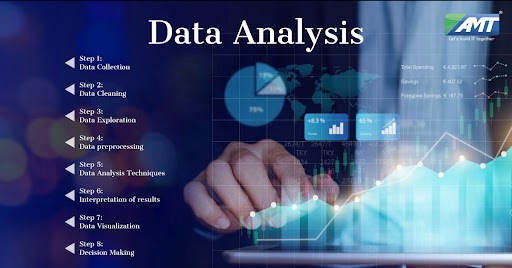
- Data Collection: The first step is to gather relevant data from various sources. This data can be in the form of structured data (e.g., databases, spreadsheets) or unstructured data (e.g., text, images, videos).
- Data Cleaning: Raw data often contains errors, missing values, or inconsistencies. Data cleaning involves identifying and correcting these issues to ensure the accuracy and reliability of the analysis.
- Data Exploration: Once the data is clean, analysts explore and summarize it to gain a better understanding of its characteristics, patterns, and potential relationships. Visualization tools are often used to aid in this process.
- Data Preprocessing: Before applying any analysis techniques, data may need to be preprocessed to transform it into a suitable format for analysis. This step can involve feature scaling, normalization, or encoding categorical variables.
- Data Analysis Techniques: Depending on the nature of the data and the goals of the analysis, various techniques can be employed, such as statistical analysis, machine learning algorithms, or other mathematical models.
- Interpretation of Results: After performing the analysis, the results need to be interpreted in the context of the problem at hand. This step involves drawing conclusions, identifying patterns, and making predictions or recommendations.
- Data Visualization: Visualizing the results of the analysis is essential to communicate findings effectively to stakeholders. Graphs, charts, and other visual representations can help convey complex information in a more understandable manner.
- Decision Making: The final step of data analysis involves using the insights gained from the analysis to support decision-making processes. This can involve making strategic business decisions, improving processes, or addressing specific problems.
Data analysis is utilized in various fields, including business, finance, healthcare, marketing, social sciences, and more. As technology and data continue to evolve, data analysis becomes increasingly important in making data-driven decisions and gaining valuable insights from the vast amount of information available.
- Types of Data Analysis:
- Descriptive Analysis: This involves summarizing and describing the main characteristics of the data, such as mean, median, mode, variance, and other statistical measures.
- Inferential Analysis: It is used to make predictions or inferences about a larger population based on a sample of data.
- Exploratory Data Analysis (EDA): EDA involves visually exploring the data to discover patterns, trends, and relationships.
- Predictive Analysis: This involves using historical data to make predictions about future events using techniques like regression, time series analysis, and machine learning algorithms.
- Prescriptive Analysis: It goes beyond predictive analysis and provides recommendations on what actions should be taken based on the data.
- Data Analysis Tools and Software:
- Spreadsheet Software: Excel, Google Sheets.
- Programming Languages: Python (with libraries like Pandas, NumPy, and Matplotlib), R, SAS, SQL, etc.
- Business Intelligence Tools: Tableau, Power BI, QlikView, etc.
- Machine Learning Frameworks: Scikit-learn, TensorFlow, PyTorch, etc.
- Data Mining: Data mining is a subset of data analysis that focuses on discovering patterns and relationships in large datasets using techniques like clustering, association rule mining, and anomaly detection.
- Big Data Analytics: With the advent of big data, data analysis techniques have evolved to handle massive datasets that cannot be processed using traditional methods. Technologies like Hadoop and Spark are commonly used for big data analytics.
- Sentiment Analysis: A specialized form of data analysis that involves using natural language processing and text analysis to determine the sentiment or emotion expressed in textual data, such as customer reviews or social media comments.
- A/B Testing: It is a technique used in marketing and product development to compare two or more versions of a product or campaign to determine which one performs better based on predefined metrics.
- Time Series Analysis: A method used to analyze data that is ordered chronologically, such as stock prices, temperature trends, or sales data.
- Data Visualization Tools: Creating insightful and meaningful visualizations is an essential part of data analysis. Besides the tools mentioned earlier, libraries like Seaborn and Plotly in Python are commonly used for data visualization.
- Ethical Considerations: Data analysts must be mindful of ethical considerations, such as data privacy, confidentiality, and potential biases that may arise during the analysis process.
Remember that effective data analysis requires a combination of technical skills, domain knowledge, critical thinking, and creativity to derive valuable insights from data and make informed decisions.
Above is a brief about Data Analysis. Watch this space for more updates on the latest trends in Technology.