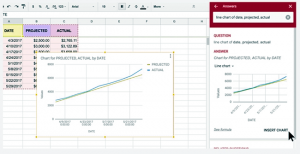
Google Sheets is getting smarter today. After adding the machine learning-powered “Explore†feature last year, which lets you ask natural language questions about your data, it’s now expanding this feature to also automatically build charts for you. This means you can now simply ask Sheets to give you a “bar chart for fidget spinner sales†and it will automatically build one for you.
All of this is backed by the same natural language understanding tech that already powered the “Explore†feature. It’s worth noting that the previous version of “Explore†could already build graphs for you, but those focused on your complete data set. It didn’t allow you to get graphs that answered specific questions.
With this new version, Google also is making it easier to keep in sync data from Sheets that you use in Docs or Slides. You could already update charts you copy into Docs and Slides with just a click, but now you also can do the same with tables.

Google Drive is complete with essential tools that help in editing, viewing, and sharing documents online. Google Sheets is one of the tools on Drive that serve as an alternative to Microsoft Excel. Today, Sheets has got a slew of nifty new features for Sheets that will help users.
One of the primary features on Sheet is the ability to create charts automatically, based on the already available spreadsheets. This tool will take a lot of work off user’s backs as Google’s powerful machine takes care of the rest. By clicking on the “explore†option, users can ask Google questions based on spreadsheets, such as “bar chart for ice cream sales†and Google will show a chart that utilizes that data.
The new feature works a lot like the already available Sheet’s feature, which pulls data from complicated spreadsheets without the need to enter formulas, users can ask a simple question and get desired results. These features are made to make work easier and also gives an edge to Google Sheets over other spreadsheet programs.
Besides, Sheets is also adding enhanced sync between Google Docs and Google Slides. The company included sync for charts in Docs and Slides, last year. Today, the same ability is being extended to tables. Now, users can copy-paste their data to other services, and then click on the “Update†button to restore that data from the original spreadsheet.
In addition to all the above-mentioned features, Sheets is also getting improvements that were demanded by users. One of these features is keyboard shortcuts to edit. Being an online service, some of the shortcuts or commands used in other similar services were not compatible, but now those commands will work on Google Sheets too. Also, users will now get options to adjust margins, scale, and alignment when printing. Similarly, editing charts is made easier by adding a new sidebar to get all the tools in one place.
The above mentioned is a brief about how Machine Learning is used in Google Sheets. Watch this Space for More Updates and Latest Trends in Technology.
